
Echarts中的得分环图表(Ring Gauge / gaugeChart ),调整图表与容器边缘的距离
·
更新一个自己遇到的小问题,可能也是一个简单的知识误区
先上效果图
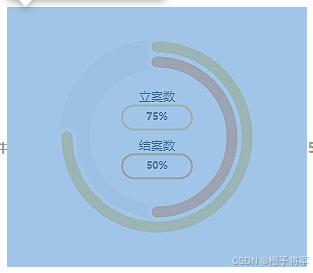
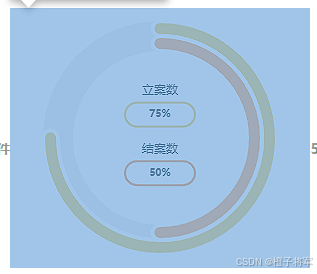
其他图表调整图表与容器边缘的距离时,一般是调整grid,比如
  grid: {
        top: '4%',
        right: '6%',
        bottom: '2%',
        left: '6%',
        containLabel: true,
      },
但是在得分环图表(gaugeChart)中,应该调整半径
  series: [
        {
        type: 'gauge',
          startAngle: 90,
          endAngle: -270,
          radius: '90%',// 默认值75%
        }
    ]
更多推荐

 9
9 0
0- 0


 已为社区贡献1条内容

所有评论(0)