
SpringCloud (十) ---------- Sleuth 分布式链路跟踪
目录
一、分布式链路跟踪概述
前面我们接触过几种微服务的监控方式,比如 Spring Boot Actuator 监控微服务,Spring Boot Admin 监控微服务,Hystrix Dashboard 监控 Hystrix 服务,Hystrix Turbine 聚合多个 Hystrix 服务的监控信息等,接下来我们要讨论的是微服务的跟踪。
对于一个大型的几十个、几百个微服务构成的微服务架构系统,通常会遇到下面一些问题,比如:
如何串联整个调用链路,快速定位问题?
如何理清各个微服务之间的依赖关系?
如何进行各个微服务接口的性能分折?
如何跟踪整个业务流程的调用处理顺序?
Spring Cloud Sleuth 为 Spring Cloud 提供了分布式跟踪的解决方案,它大量借用了 Google Dapper、Twitter Zipkin 和 Apache HTrace 的设计,帮我们解决像上面提到的问题。
Spring Cloud Sleuth 可以追踪 10 种类型的组件:
async、Hystrix、messaging、websocket、rxjava、scheduling、web (Spring MVC Controller、Servlet) 、webclient (Spring RestTemplate) 、Feign、Zuul。
微服务的调用链路:
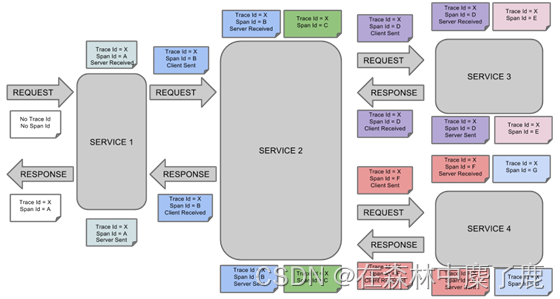
这里面涉及到 Spring Cloud Sleuth 的一些术语:
span (跨度)
基本工作单元。span用一个 64 位的 id 唯一标识。除ID外,span 还包含其他数据,例如描述、时间戳事件、键值对的注解 (标签)、spanID、span父ID等。span被启动和停止时,记录了时间信息。初始化 span 被称为 rootspan,该 span的 id 和 trace 的 ID 相等。
trace (跟踪)
一组共享 rootspan 的 span 组成的树状结构称为 traceo trace 也用一个 64 位的 ID 唯一标识, trace 中的所有 span 都共享该 trace 的 ID。
annotation (标注)
annotation用来记录事件的存在,其中,核心annotation 用来定义请求的开始和结束。
CS (Client Sent 客户端发送)
客户端发起一个请求,该 annotation 描述了 span 的开始。
SR (Server Received服务器端接收)
服务器端获得请求并准备处理它。如果用 SR 减去 CS 时间戳,就能得到网络延迟。
SS (Server Sent服务器端发送)
该 annotation 表明完成请求处理 (当响应发回客户端时) 。如果用 SS 减去 SR 时间戳,就能得到服务器端处理请求所需的时间。
CR (Client Received客户端接收)
span 结束的标识。客户端成功接收到服务器端的响应。如果 CR 减去 CS 时间戳,就能得到从客户端发送请求到服务器响应的所需的时间。
二、Spring Cloud Sleuth
Spring Cloud Sleuth 对于分布式链路的跟踪仅仅是生成一些数据,这些数据不便于人类阅读,所以我们一般把这种跟踪数据上传给 Zipkin Server,由 Zipkin 通过UI 页面统一进行数据的展示。
三、整合 Zipkin 实现分布式链路跟踪
1. Zipkin 概述
Zipkin 是 Twitter 开源的分布式实时数据跟踪系统 ,基于 Google Dapper 的论文设计而成,Google 开源了 Dapper 链路追踪组件,并在 2010 年发表了论文《Dapper, a Large-Scale Distributed Systems Tracing Infrastructure》,这篇文章是业内实现链路追踪的标杆和理论基础,具有非常大的参考价值。
Zipkin 它的主要功能是收集系统的时序数据,从而追踪微服务架构的系统延时等问题,从而达到链路调用监控跟踪作用,另外 Zipkin 还提供了一个非常友好的 UI界面,来帮助分析追踪数据,Zipkin 官网地址:http://zipkin.io 。
分布式跟踪系统有一些成熟的开源产品,比如:韩国 Naver 的 Pinpoint,Apache的 HTrace,阿里的鹰眼 EagleEye,京东的 Hydra 等,这些产品我们也把他们叫做 APM (应用性能管理) 工具。
2. 搭建 Zipkin Server
A、创建一个 SpringBoot 项目,用于搭建 Zipkin Server 服务端
B、添加依赖
<!-- https://mvnrepository.com/artifact/io.zipkin.java/zipkin-autoconfigure-ui -->
<dependency>
    <groupId>io.zipkin.java</groupId>
    <artifactId>zipkin-autoconfigure-ui</artifactId>
    <version>2.12.9</version>
</dependency>
<!-- https://mvnrepository.com/artifact/io.zipkin.java/zipkin-server -->
<dependency>
    <groupId>io.zipkin.java</groupId>
    <artifactId>zipkin-server</artifactId>
    <version>2.12.9</version>
</dependency>
C、配置文件
#zipkin启动报错无法访问的解决方法
management.metrics.web.server.autoTimeRequests=false
D、在启动类上加入注解 @EnableZipkinServer
@EnableZipkinServer
@SpringBootApplication
public class SleuthApplication {
    public static void main(String[] args) {
        SpringApplication.run(SleuthApplication.class);
    }
}
E、启动 zipkin server 服务
访问 http://localhost:9410 (默认启动了 Undertow 服务的9410端口)
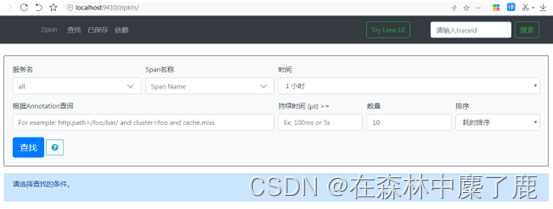
服务名 :就是微服务配置文件中的 application name。
Span 名称 :跨度。
时间段 :现在查询的时间段。
根据 Annotation 查询:根据标注查询,用于自定义查询条件。
持续时间:一次调用链的持续时间。
数量:一页数量。
排序:排序规则。
目前我们还查询不到数据,我们需要把微服务和 sleuth 整合,并把 sleuth 记录的数据上传到 zipkin server,此时我们才能在页面上看到数据。
3. Sleuth 微服务整合 Zipkin
将我们的微服务的跟踪数据上传到 Zipkin Server 中。
注意,每个微服务都需要和 Zipkin 整合,这样便于把我们的各个微服务的调用链路信息上传到 Zipkin Server 中。
在各个微服务里面进行操作 :
A、添加依赖
<!-- spring-cloud-starter-sleuth -->
<dependency>
    <groupId>org.springframework.cloud</groupId>
    <artifactId>spring-cloud-starter-sleuth</artifactId>
</dependency>

<!-- spring-cloud-starter-zipkin -->
<dependency>
    <groupId>org.springframework.cloud</groupId>
    <artifactId>spring-cloud-starter-zipkin</artifactId>
</dependency>
B、配置文件
#指定Zipkin server地址
spring.zipkin.base-url=http://localhost:9410
#发送跟踪数据到zipkin的类型web(http)
spring.zipkin.sender.type=web
#request采样的数量 默认是0.1 也即是10%,即采样10%的请求数据;
#因为在分布式系统中,数据量可能会非常大,因此采样非常重要我们示例数据少最好配置为1全采样,100%的采集会稍微影响一点性能
spring.sleuth.sampler.probability=1.0
四、Zipkin Server 数据持久化
前面我们已经把分布式链路调用信息上传到Zipkin Server 上,通过 Zipkin Server 的 UI 界面我们能看到调用链路信息,但是这些上传了的跟踪信息没有持久化保存,当 Zipkin 重启后分布式链路数据就全部清空了,因为 Zipkin Server 默认数据是存储在内存中的,所以为了后续一直都能查看调用链路信息,最好是将这些信息持久化保存。
1. 使用 Elastic Search 做数据持久化
Elastic Search 是一个分布式可扩展的实时搜索和分析引擎,一个建立在全文搜索引擎 Apache Lucene 基础上的搜索引擎,我们暂时不想象那么复杂,我们可以把它当作一个数据库来对待,就是用来存储数据的。
GitHub:https://github.com/elastic/elasticsearch
下载:https://www.elastic.co/cn/downloads/elasticsearch
解压下载后的压缩包即完成安装,切换到 bin 目录,使用双击 elasticsearch.bat脚本启动。
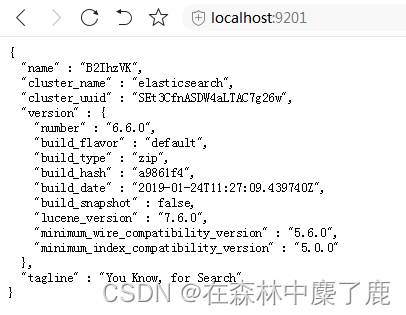
启动后访问:http://localhost:9201,如果能返回 json 信息则表示安装启动 OK。
2. zipkin 与 Elastic Search 整合
A、在 Zipkin Server 中添加依赖
<!-- https://mvnrepository.com/artifact/io.zipkin.java/zipkin-autoconfigure-storage-elasticsearch-http -->
<dependency>
    <groupId>io.zipkin.java</groupId>
    <artifactId>zipkin-autoconfigure-storage-elasticsearch-http</artifactId>
    <version>2.8.4</version>
</dependency>
B、配置文件
zipkin.storage.type=elasticsearch
zipkin.storage.elasticsearch.cluster=elasticsearch
zipkin.storage.elasticsearch.hosts=http://localhost:9201
zipkin.storage.elasticsearch.index=zipkin
至此 Zipkin Server上的跟踪数据便存储在了 Elasticsearch 中,当 Zipkin Server 重启或宕机,历史数据依然不会丢失。
更多推荐

 1
1 0
0- 0


 已为社区贡献2条内容

所有评论(0)