
ECharts 使用地图
·
ECharts 使用地图
概述
ECharts 5 开始官方不再内置地图数据。
地图数据下载:
https://github.com/echarts-maps/echarts-china-cities-js
https://datav.aliyun.com/portal/school/atlas/area_selector
配置项
geo配置
- 专门用于绘制地图地图
- 负责地图的基本显示(如:地图类型、区域颜色、边界样式等)
- 可以独立运行不依赖 series 数据,常用于提供地理背景支持地图交互(如:点击、缩放、拖拽)
const option = {
    title: {
        text: '中国主要城市分布',
        left: 'center',
        textStyle: { fontSize: 18 }
    },
    tooltip: {
        trigger: 'item',
        formatter: (params: any) => `${params.name}<br/>数值: ${params.value[2]}`
    },

    // 4. Geo 组件核心配置
    geo: {
        map: 'china',  // 地图名称
        roam: true,    // 开启缩放和平移
        zoom: 1.2,     // 初始缩放比例
        center: [104, 36],  // 地图中心点坐标

        label: { show: true, fontSize: 8, color: '#333' },
        itemStyle: { areaColor: '#f0f9ff', borderColor: '#fff', borderWidth: 1 },
        emphasis: {
            label: { show: true, fontSize: 10, color: '#fff' },
            itemStyle: { areaColor: '#409eff' }
        }
    },

    // 5. 散点图系列(叠加在 Geo 上)
    series: [
        {
            name: '城市数据',
            type: 'scatter',
            coordinateSystem: 'geo',  // 使用地理坐标系(必须)
            data: cityData,
            symbolSize: (val: any) => val[2] / 5,
            label: { show: true, formatter: '{b}', position: 'right', fontSize: 9 },
            emphasis: { itemStyle: { color: '#ff4d4f' } }
        }
    ]
}
series map配置
- 用于在地图上绘制各种图表
- 负责将数据可视化(如:散点图、热力图、路径图等)
- 依赖 geo 组件提供的地理坐标系或独立使用地理坐标系
- series 可以通过
coordinateSystem:geo关联到 geo 组件,关联后 series 数据会根据 geo 组件的坐标系地位 - series 也可以不依赖 geo 组件,通过 map 属性指定地图类型
const option = {
    title: {
        text: '中国各省份GDP分布',
        left: 'center',
        textStyle: { fontSize: 18 }
    },

    tooltip: {
        trigger: 'item',
        formatter: '{b}<br/>GDP: {c} 亿元' // {b}省份名,{c}数值
    },

    // 视觉映射组件(用于数据可视化)
    visualMap: {
        type: 'continuous',
        min: 0,
        max: 130000,
        left: 'left',
        top: 'bottom',
        text: ['高', '低'],
        calculable: true,
        inRange: {
            color: ['#e0f3ff', '#409eff', '#096dd9'] // 颜色渐变
        }
    },

    // 4. 直接使用 series map 类型
    series: [
        {
            name: 'GDP数据',
            type: 'map', // 地图系列类型
            map: 'china', // 地图名称,对应注册的地图
            roam: true, // 开启缩放和平移
            zoom: 1.2, // 初始缩放比例
            center: [104, 36], // 地图中心点坐标

            // 数据绑定
            data: provinceData,

            // 标签配置
            label: {
                show: true,
                fontSize: 8,
                color: '#333'
            },

            // 区域样式
            itemStyle: {
                borderColor: '#fff',
                borderWidth: 1
            },

            // 高亮样式(鼠标悬停)
            emphasis: {
                label: {
                    show: true,
                    fontSize: 10,
                    color: '#fff'
                },
                itemStyle: {
                    areaColor: '#ff6b35' // 高亮颜色
                }
            }
        }
    ]
}
使用
geo+散点图
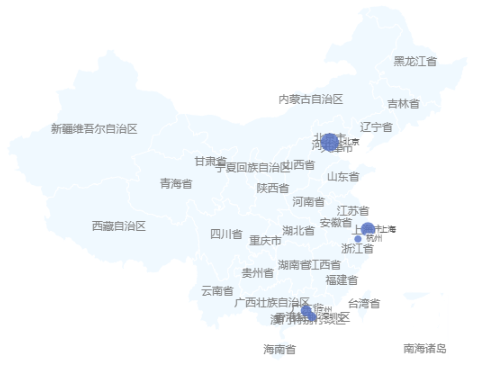
<script setup>
import ChinaMap from "@/assets/json/china.json";
import * as echarts from "echarts";
import {onMounted, onUnmounted, useTemplateRef} from "vue";

const mapRef = useTemplateRef("mapRef");
const mapName = "china";
let chartInstance;

const cityData = [
  {name: "北京", value: [116.4074, 39.9042, 100]},
  {name: "上海", value: [121.4737, 31.2304, 80]},
  {name: "广州", value: [113.2644, 23.1291, 60]},
  {name: "深圳", value: [114.0579, 22.5431, 50]},
  {name: "杭州", value: [120.1551, 30.2741, 40]}
];

function initMap() {
  echarts.registerMap(mapName, ChinaMap);
  chartInstance = echarts.init(mapRef.value);
  const option = {
    title: {
      text: "geo+散点图",
      left: "center"
    },
    tooltip: {
      trigger: "item",
      formatter: (params) => `${params.name}<br/>数值: ${params.value[2]}`
    },
    geo: {
      type: "map",
      map: mapName,
      roam: false,
      label: {show: true, color: "gray"},
      itemStyle: {areaColor: "#f0f9ff", borderColor: "#fff", borderWidth: 1},
      emphasis: {
        label: {show: true, fontSize: 10, color: "#fff"},
        itemStyle: {areaColor: "#409eff"}
      },
    },
    series: [{
      name: "城市数据",
      type: "scatter",
      coordinateSystem: "geo",  // 使用地理坐标系(必须)
      data: cityData,
      symbolSize: (val) => val[2] / 5,
      label: {show: true, formatter: "{b}", position: "right", fontSize: 9},
      emphasis: {itemStyle: {color: "#ff4d4f"}}
    }]
  };
  chartInstance.setOption(option);
}

onMounted(() => {
  initMap();
});

onUnmounted(() => {
  if (chartInstance) {
    chartInstance.dispose();
    chartInstance = null;
  }
});
</script>

<template>
  <div class="wrap">
    <div ref="mapRef" style="width:100%;height:700px;"></div>
  </div>
</template>
使用visualMap

<script setup>
import ChinaMap from "@/assets/json/china.json";
import * as echarts from "echarts";
import {onMounted, onUnmounted, useTemplateRef} from "vue";

const mapRef = useTemplateRef("mapRef");
const mapName = "china";
let chartInstance;

const cityData = [
  {name: "北京市", value: 199},
  {name: "天津市", value: 42},
  {name: "河北省", value: 102},
  {name: "山西省", value: 81},
  {name: "内蒙古自治区", value: 47},
  {name: "辽宁省", value: 67},
  {name: "吉林省", value: 82},
  {name: "黑龙江省", value: 123},
  {name: "上海市", value: 24},
  {name: "江苏省", value: 92},
  {name: "浙江省", value: 114},
  {name: "安徽省", value: 109},
  {name: "福建省", value: 116},
  {name: "江西省", value: 91},
  {name: "山东省", value: 119},
  {name: "河南省", value: 137},
  {name: "湖北省", value: 116},
  {name: "湖南省", value: 114},
  {name: "重庆市", value: 91},
  {name: "四川省", value: 125},
  {name: "贵州省", value: 62},
  {name: "云南省", value: 83},
  {name: "西藏自治区", value: 9},
  {name: "陕西省", value: 80},
  {name: "甘肃省", value: 56},
  {name: "青海省", value: 10},
  {name: "宁夏回族自治区", value: 18},
  {name: "新疆维吾尔自治区", value: 180},
  {name: "广东省", value: 123},
  {name: "广西壮族自治区", value: 59},
  {name: "海南省", value: 14},
];

function initMap() {
  echarts.registerMap(mapName, ChinaMap);
  chartInstance = echarts.init(mapRef.value);
  const option = {
    title: {
      text: "visualMap",
      left: "center"
    },
    visualMap: {
      left: "20%",
      bottom: "20%",
      seriesIndex: [0],
      inRange: {
        color: ["#04387b", "#467bc0"]
      }
    },
    series: [
      {
        type: "map",
        map: mapName,
        name: "中国地图",
        data: cityData,
        label: {
          show: true,
          color: "gray"
        },
        itemStyle: {
          areaColor: "none",
          borderColor: "black"
        },
        emphasis: {
          itemStyle: {areaColor: "#4499d0"},
          label: {color: "white"},
        },
        select: {
          itemStyle: {areaColor: "#4499d0"},
          label: {color: "white"},
        }
      }
    ]
  };
  chartInstance.setOption(option);
}

onMounted(() => {
  initMap();
});

onUnmounted(() => {
  if (chartInstance) {
    chartInstance.dispose();
    chartInstance = null;
  }
});
</script>

<template>
  <div class="wrap">
    <div ref="mapRef" style="width:100%;height:700px;"></div>
  </div>
</template>
series+散点图
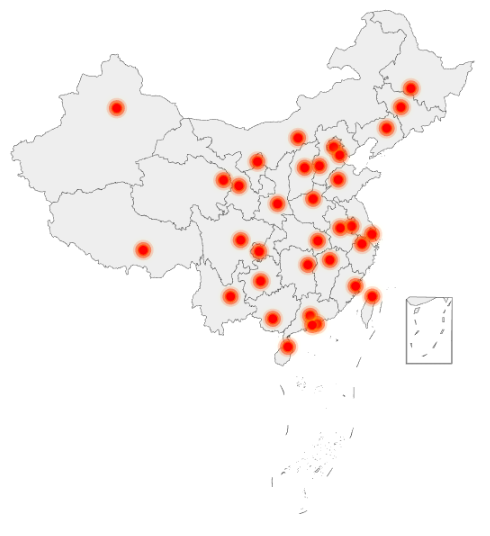
<script setup>
import {onMounted, onUnmounted, useTemplateRef} from "vue";
import * as echarts from "echarts";
import ChinaMap from "@/assets/json/china.json";
import {getRandomInt} from "@/utils/utils.js";

const mapRef = useTemplateRef("mapRef");
const mapName = "china";
let chartInstance;

function initMap() {
  echarts.registerMap(mapName, ChinaMap);
  chartInstance = echarts.init(mapRef.value);
  const convertData = () => {
    const features = echarts.getMap(mapName).geoJSON.features;
    const arr = [];
    for (let item of features) {
      console.log("item=>", item);
      const name = item.properties.name;
      const center = item.properties.center;
      if (name && center && Array.isArray(center)) {
        arr.push({
          name,
          value: [...center, getRandomInt()]
        });
      }
    }
    console.log(arr);
    return arr;
  };
  const option = {
    title: {
      text: "散点图",
      left: "center"
    },
    tooltip: {},
    geo: {
      map: mapName
    },
    series: [
      {
        type: "effectScatter",
        name: "充电桩散点图",
        geoIndex: 0,
        coordinateSystem: "geo",
        data: convertData(),
        symbolSize: 10,
        itemStyle: {
          color: "red",
          shadowBlur: 10,
          shadowColor: "yellow",
        },
        tooltip: {
          show: true,
          trigger: "item",
          formatter: function (params) {
            return `${params.seriesName}<br>${params.name}: ${params.value[2]}`;
          }
        }
      }
    ]
  };
  chartInstance.setOption(option);
}

onMounted(() => {
  initMap();
});

onUnmounted(() => {
  if (chartInstance) {
    chartInstance.dispose();
    chartInstance = null;
  }
});
</script>

<template>
  <div class="wrap">
    <div ref="mapRef" style="width:100%;height:700px;"></div>
  </div>
</template>
地图下钻
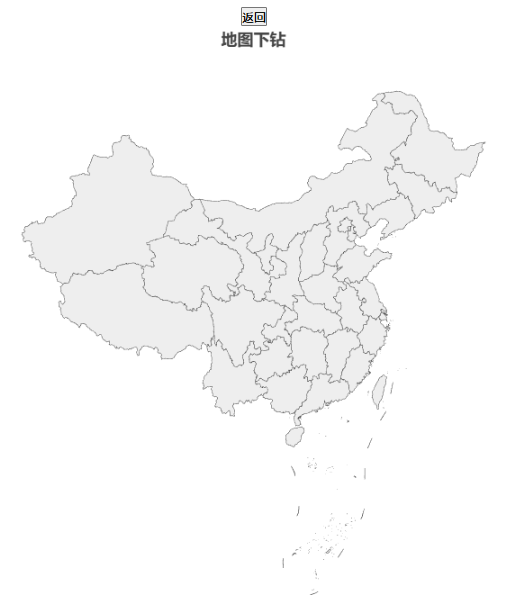
<script setup>
import {onMounted, onUnmounted, useTemplateRef} from "vue";
import * as echarts from "echarts";
import ChinaMap from "@/assets/json/china.json";
import GuangdongMap from "@/assets/json/guangdong.json";
import FujianMap from "@/assets/json/fujian.json";

const map = useTemplateRef("map");
const mapName = "中国";
let chartInstance = null;
let option = {};

function initMap() {
  echarts.registerMap(mapName, ChinaMap);
  chartInstance = echarts.init(map.value);
  option = {
    title: {
      text: "地图下钻",
      left: "center"
    },
    series: [{
      type: "map",
      map: mapName,
    }]
  };
  chartInstance.setOption(option);
  chartInstance.on("click", (event) => {
    if (event.name === "广东省") {
      const mapName = "广东省";
      if (!echarts.getMap(mapName)) {
        echarts.registerMap(mapName, GuangdongMap);
        console.log("注册广东省地图");
      }
      option.series[0].map = event.name;
      chartInstance.setOption(option);
    } else if (event.name === "福建省") {
      const mapName = "福建省";
      if (!echarts.getMap(mapName)) {
        echarts.registerMap(mapName, FujianMap);
        console.log("注册福建省地图");
      }
      option.series[0].map = event.name;
      chartInstance.setOption(option);
    }
  });
  window.addEventListener("resize", () => {
    chartInstance.resize();
  });
}

function back() {
  option.series[0].map = mapName;
  chartInstance.setOption(option);
}

onMounted(() => {
  initMap();
});

onUnmounted(() => {
  if (chartInstance) {
    chartInstance.dispose();
    chartInstance = null;
  }
});
</script>

<template>
  <div style="text-align: center;">
    <button @click="back">返回</button>
  </div>
  <div class="wrap">
    <div ref="map" style="width:100%;height:700px;"></div>
  </div>
</template>
源码下载

更多推荐



 4
4 0
0- 0


 已为社区贡献1条内容

所有评论(0)