
WPF开发随笔-使用livecharts2模拟绘制脑电图心电图肌电图
·
1、安装livecharts2,勾选包括预发布版本,搜索下载 LiveChartsCore.SkiaSharpView.WPF
注意:使用lvc2 ,好像必须使用mvvm开发模式,建议安装一个communitytoolkit
也可以参考官方模版:samples.general.realTime - 实时图表2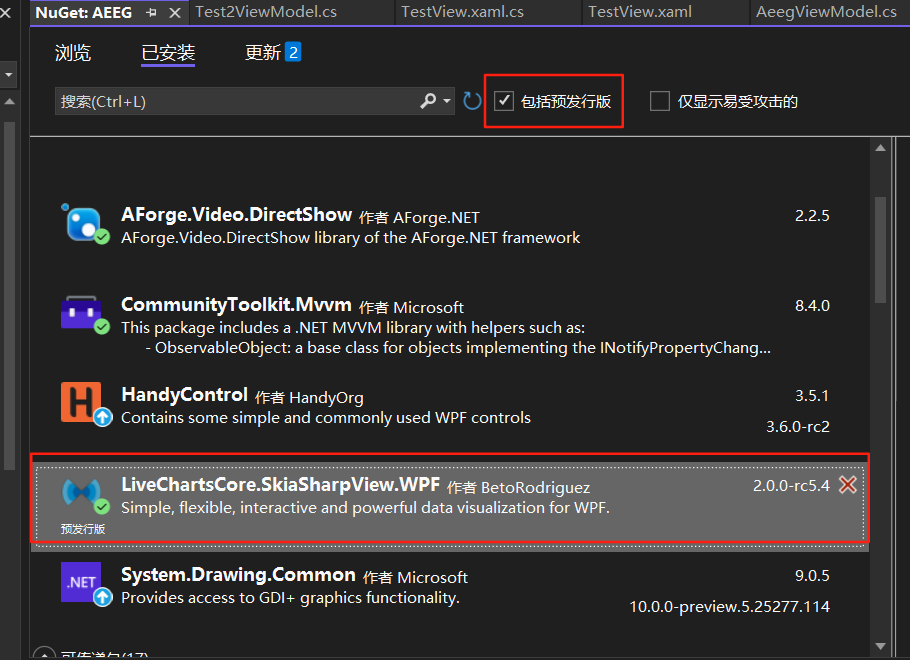
2、xaml引用如下:
<UserControl x:Class="AEEG.Views.TestView"
             xmlns="http://schemas.microsoft.com/winfx/2006/xaml/presentation"
             xmlns:x="http://schemas.microsoft.com/winfx/2006/xaml"
             xmlns:mc="http://schemas.openxmlformats.org/markup-compatibility/2006"
             xmlns:d="http://schemas.microsoft.com/expression/blend/2008"
             xmlns:lvc2="clr-namespace:LiveChartsCore.SkiaSharpView.WPF;assembly=LiveChartsCore.SkiaSharpView.WPF"
             xmlns:vm="clr-namespace:AEEG.ViewModels"
             xmlns:local="clr-namespace:AEEG.Views"
             xmlns:dv="clr-namespace:AEEG.AeegCanvas"
             mc:Ignorable="d"
             d:DesignHeight="600" d:DesignWidth="800">

    <UserControl.DataContext>
        <vm:Test2ViewModel/>
    </UserControl.DataContext>

    <lvc2:CartesianChart
        SyncContext="{Binding Sync}"
        Series="{Binding Series}"
        YAxes="{Binding YAxes}"
        XAxes="{Binding XAxes}">
    </lvc2:CartesianChart>

</UserControl>
3、viewmodel代码如下
using System.Collections.ObjectModel;
using LiveChartsCore;
using LiveChartsCore.Defaults;
using LiveChartsCore.SkiaSharpView;
using LiveChartsCore.SkiaSharpView.Painting;
using SkiaSharp;

namespace AEEG.ViewModels
{
    public partial class Test2ViewModel
    {

        // 随机数生成器,用于生成测试数据
        private readonly Random _random = new();
        // 存储时间序列数据点的集合
        private const int MaxXValue = 71; // 修改最大点数为70,实现0-70点循环
        private ObservableCollection<ObservableCollection<ObservablePoint>> _curveData = [];
        public ObservableCollection<ISeries> Series { get; set; }
        private int i = 0;
        private bool Execute_action = true;
        // X轴配置集合
        public Axis[] XAxes { get; set; }
        = [new Axis
        {
            IsVisible = false,
            MinLimit = 0,
            MaxLimit = 70,
            MinStep = 1,
        }];
        public Axis[] YAxes { get; set; } = [new Axis
        {
            IsVisible = false,
            MinLimit = -100,
            MaxLimit = 100,
        }];
        public object Sync { get; } = new object();
        public bool IsReading { get; set; } = true;
        public bool IsAdd { get; set; } = true;
        public bool IsFirstSegment{ get; set; } = true;


        // 构造函数,初始化图表配置并启动数据读取
        public Test2ViewModel()
        {
            _curveData.Add(new ObservableCollection<ObservablePoint>());
            _curveData.Add(new ObservableCollection<ObservablePoint>());

            Series = [
                new LineSeries<ObservablePoint>
                {
                    Values = _curveData[0],
                    Fill = null,
                    GeometryFill = null,
                    GeometryStroke = null,
                    Stroke = new SolidColorPaint(SKColors.DodgerBlue) { StrokeThickness = 1 },
                },
                 new LineSeries<ObservablePoint>
                {
                    Values = _curveData[1],
                    Fill = null,
                    GeometryFill = null,
                    GeometryStroke = null,
                    Stroke = new SolidColorPaint(SKColors.DodgerBlue) { StrokeThickness = 1 },
                }

            ];
            // 启动数据读取任务(不等待完成)
            _ = ReadData();
        }

        /// 异步读取数据并更新图表的方法
        private async Task ReadData()
        {
            // 当IsReading为true时持续运行

            while (IsReading)
            {
                await Task.Delay(100);
                // 使用Sync对象进行线程同步,确保线程安全
                lock (Sync)
                {
                    if (MaxXValue > _curveData[0].Count && IsAdd)
                    {
                        _curveData[0].Add(new ObservablePoint(i++, _random.Next(-10, 10)));
                    }
                    else
                    {
                        if (_curveData[0].Count >= MaxXValue)
                        {
                            i = 0;
                            IsAdd = false;
                            //线条颜色相关
                             if (IsFirstSegment)
                             {
                                ((LineSeries<ObservablePoint>)Series[0]).Stroke = new                     SolidColorPaint(SKColors.SlateGray);
                                 ((LineSeries<ObservablePoint>)Series[1]).Stroke = new SolidColorPaint(SKColors.DodgerBlue);
                                 IsFirstSegment = false;
                             }
                        }
                        _curveData[0].RemoveAt(0);
                        _curveData[1].Add(new ObservablePoint(i++, _random.Next(-10, 10)));
                        if (_curveData[1].Count >= MaxXValue && _curveData[0].Count == 0)
                        {
                            i = 0;
                            _curveData.Move(0, 1);
                            //始终保持新增曲线蓝色,递减曲线灰色
                            if (Execute_action)
                            {
                                ((LineSeries<ObservablePoint>)Series[0]).Stroke = new SolidColorPaint(SKColors.DodgerBlue);
                                ((LineSeries<ObservablePoint>)Series[1]).Stroke = new SolidColorPaint(SKColors.SlateGray);
                                Execute_action = false;
                            }
                            else
                            {
                                ((LineSeries<ObservablePoint>)Series[0]).Stroke = new SolidColorPaint(SKColors.SlateGray);
                                ((LineSeries<ObservablePoint>)Series[1]).Stroke = new SolidColorPaint(SKColors.DodgerBlue);
                                Execute_action = true;
                            }
                        }

                    }

                }

            }


        }
    }

}
4、运行效果如下,自己动态改变数据调节幅度大小即可

更多推荐


 8
8 0
0- 0


 已为社区贡献1条内容

所有评论(0)